In short: instead of collecting data in one app and then exporting, syncing and publishing it to a web map, you collect it directly on a shared, live web map in the browser — a point at the exact spot, a photo, a line or a shape. There is no separate sync step, because the field and the office work on the same map. GeoMarkup is free, runs in any browser on phone, tablet and desktop, and lets you import your own geodata in 6 formats.
Field data has a way of getting stuck. Someone walks a site, photographs what matters and drops pins in a notes app — and then the data sits on that phone. Or a team collects in a dedicated field app, and the results only reach the people who need them after an export, a sync and a publishing step. By the time it lands on a map the office can actually open, the moment has passed and half the context is lost.
This guide shows a simpler way: get field data onto a live web map with no GIS pipeline at all. You collect straight on the map, attach the photo to the exact point, set a status, and your whole team opens the same map from a link — on a desktop in the office and a phone in the field.
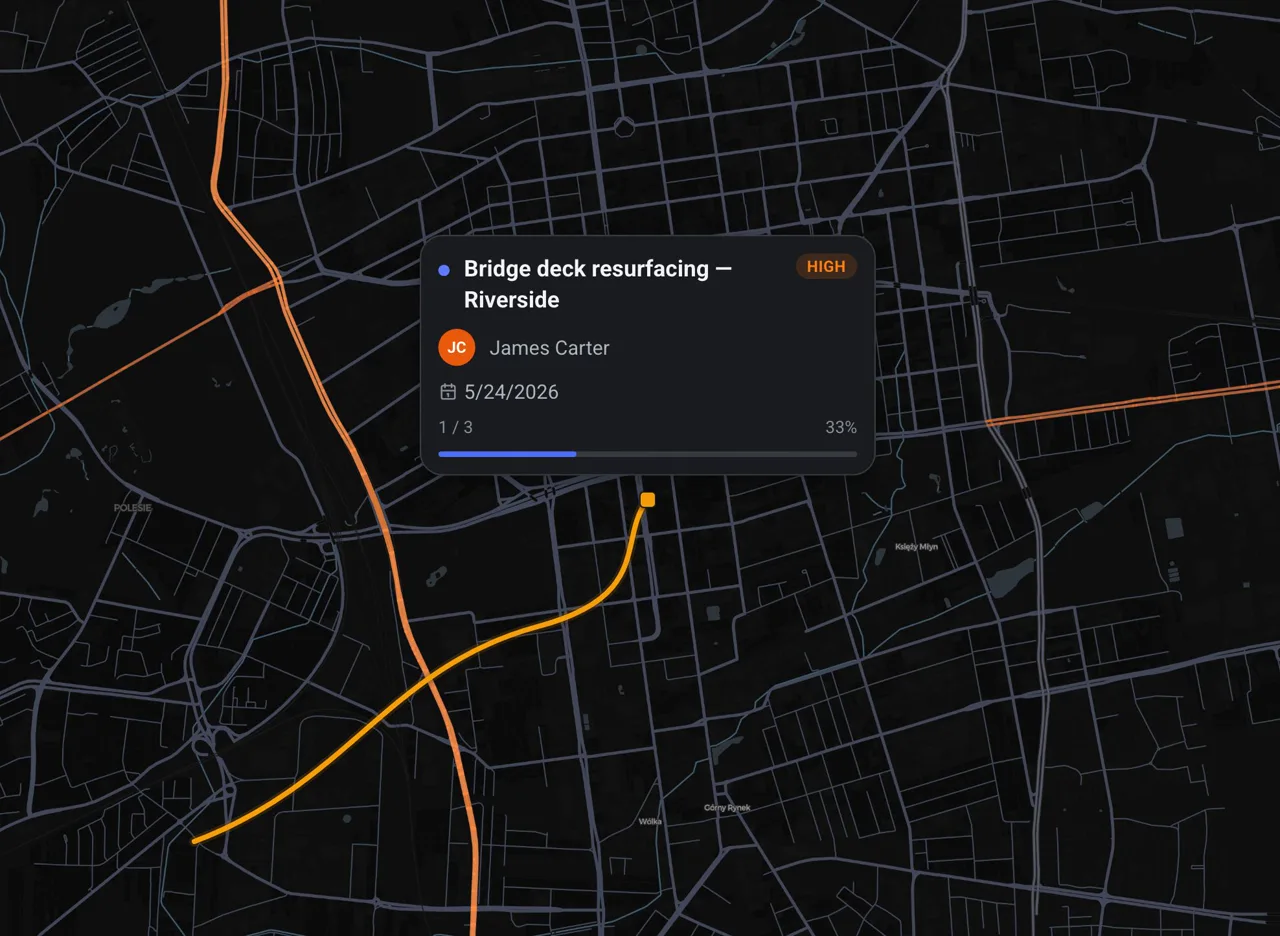
This guide was written by the GeoMarkup team. It describes a real way of working with the product; the screenshots are from the app and the data shown is sample data. Features reflect the product as of June 2026 and can change.
What “syncing field data to a web map” usually means — and why GeoMarkup skips it
In a classic GIS setup, getting field data onto a web map is a pipeline. A crew collects features in a mobile field app, the device syncs those edits when it gets a connection, and the data is then published as a layer into a web map that the office can view. It works — but it is several moving parts, it assumes someone administers the GIS, and there is always a lag between “captured in the field” and “visible to the team.”
GeoMarkup removes the pipeline by removing the gap between the two maps. There is only one map: the workspace map your whole team already uses. The field crew and the office both open it in a browser. So when you save a point in the field, you are not filling a separate app that has to sync later — you are editing the team’s web map directly.
| Step | The usual field-data-to-web-map pipeline | GeoMarkup |
|---|---|---|
| Collect | In a dedicated field app, often offline | Directly on the shared web map, in the browser |
| Get it off the device | Sync the device when online | Nothing to sync — it’s already on the map |
| Make it visible to the office | Publish a layer to a web map | Already visible — same map, same workspace |
| Discuss it | Email, chat, a separate thread | Comments on the point itself, in real time |
| Set it up | A GIS administrator and an org account | A free workspace, opened in minutes |
If you have been searching for the best tool for syncing field data to web maps, the honest answer for a lot of teams is a tool where there is no sync step — because the field and the web map are the same thing.
Step 1 — Collect data right on the map
Instead of describing a location in words, you click it. A point on the map gets a marker at the exact spot, and you fill in the location field with a human reference (a road and chainage, an address, a site name). The record carries the coordinates, so anyone who opens it sees the same pin — no more “somewhere past the junction.”
You are not limited to single points. GeoMarkup gives you three geometry types from one drawing toolbox — markers, lines and shapes (rectangle, circle, polygon) — with a library of field-ready marker icons (hazard, barrier, construction, inspection and more) and full undo/redo. A line traces a stretch of road or a route; a shape outlines a work zone or an affected area.
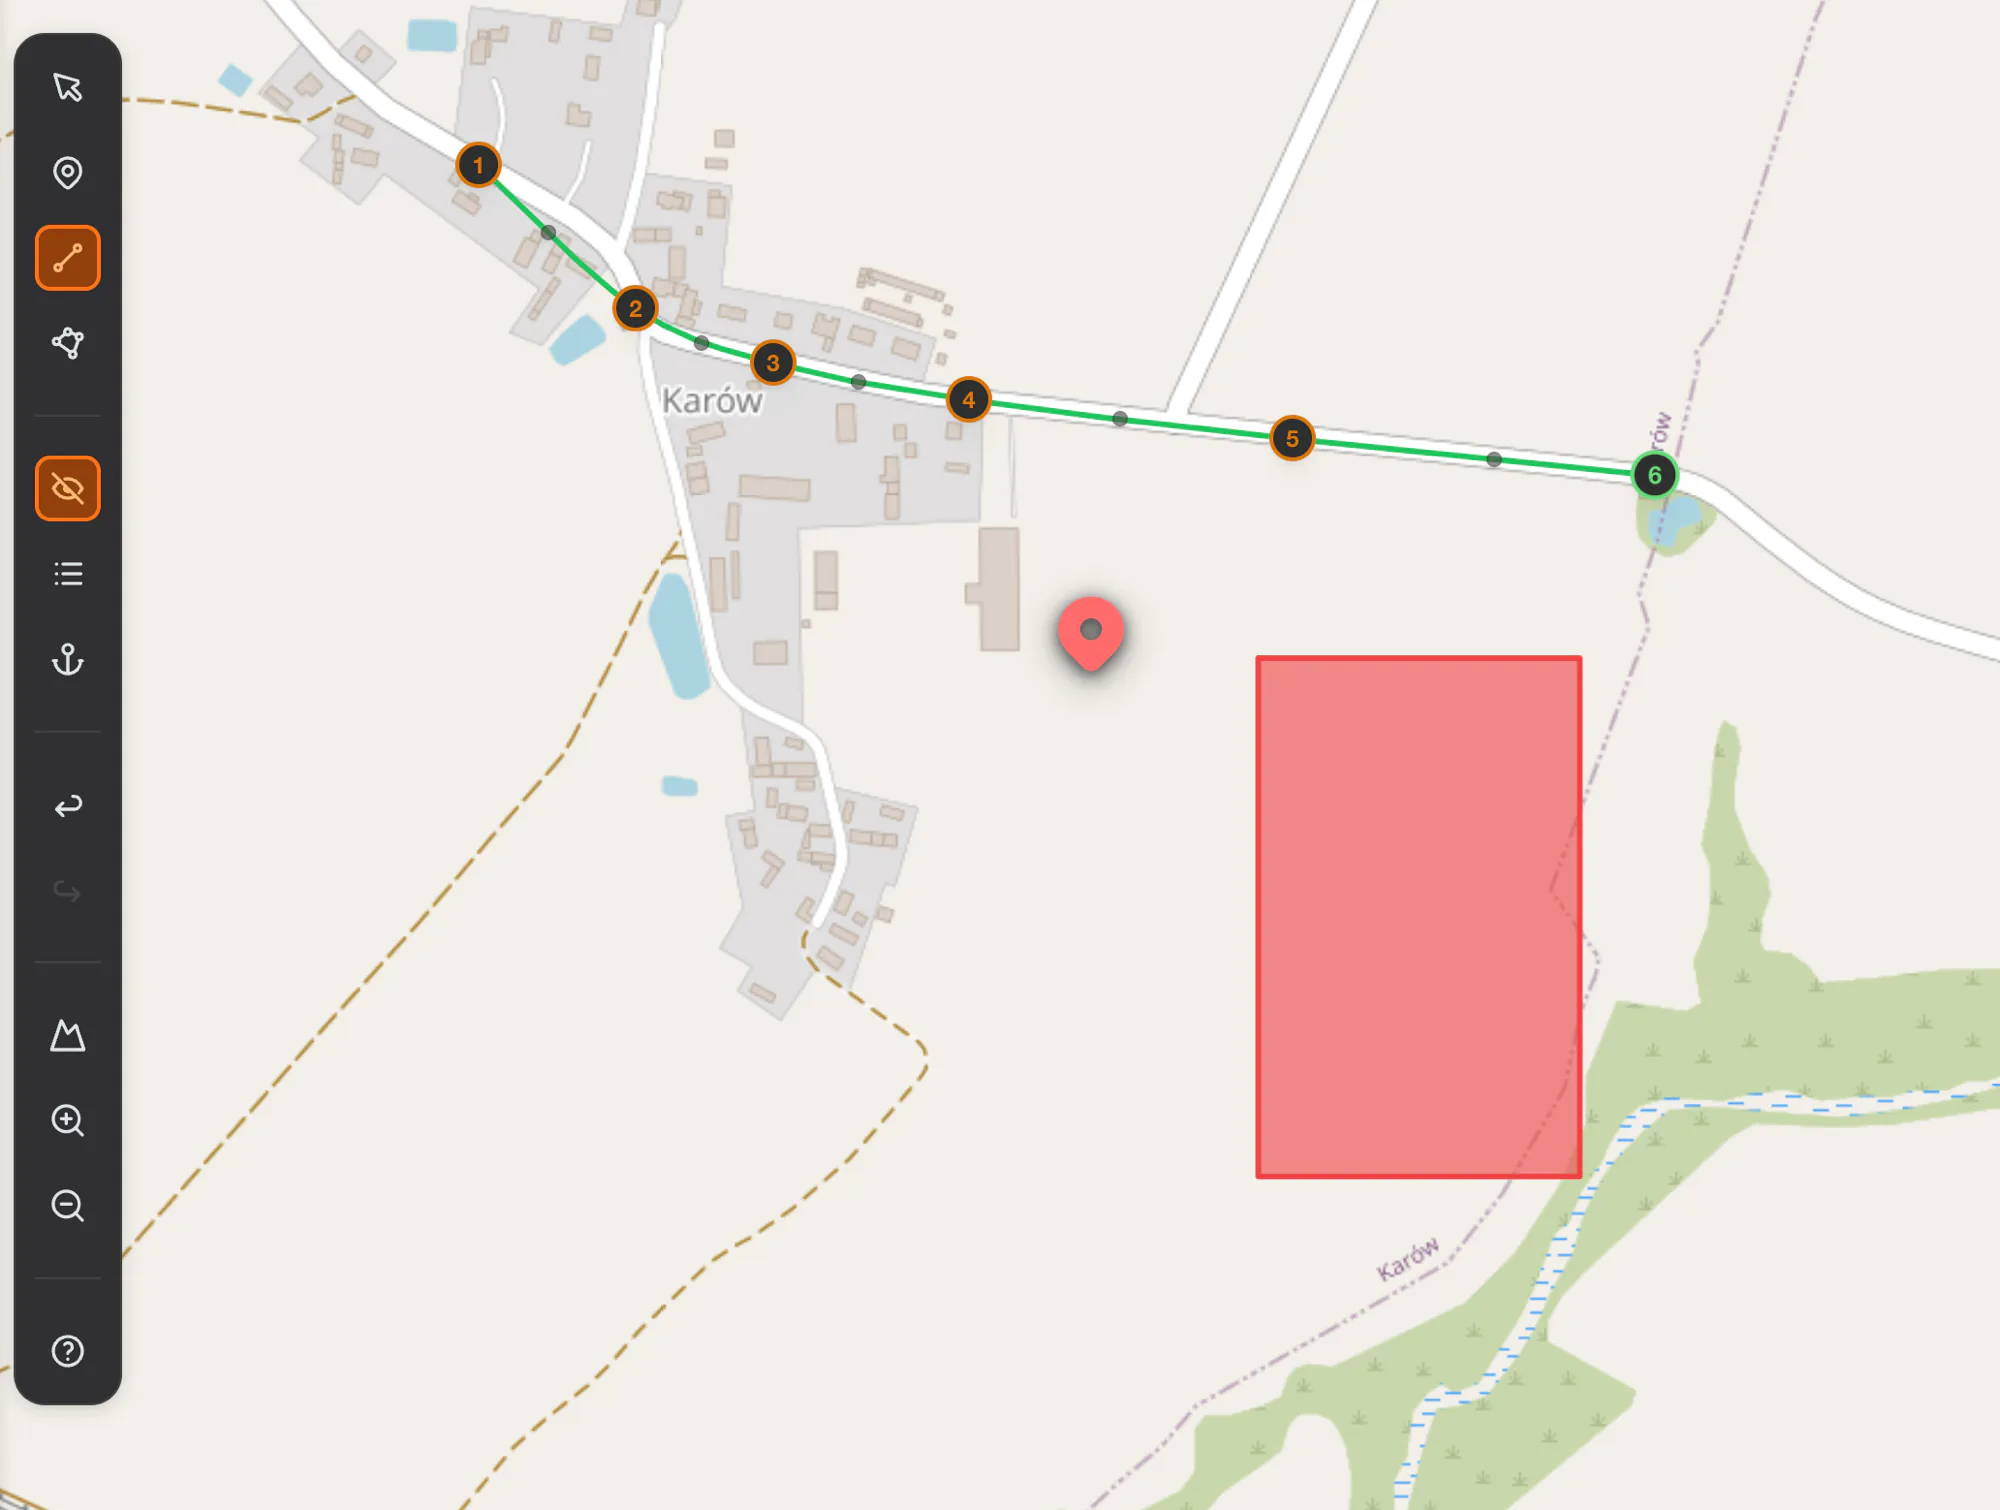
On a phone in the field you can also use the device’s GPS to drop a point at your current position, so the pin lands where you are standing rather than where you guess on the map.
Step 2 — Attach the photo and the details
A point is only half the story; the photo is the other half. You attach photos and files straight to the point — as many as the case needs, up to 25 MB each. Images open in an in-app preview, with no download step, so the office and the field crew look at the very same photo: the crack, the sign, the obstruction, the surroundings.
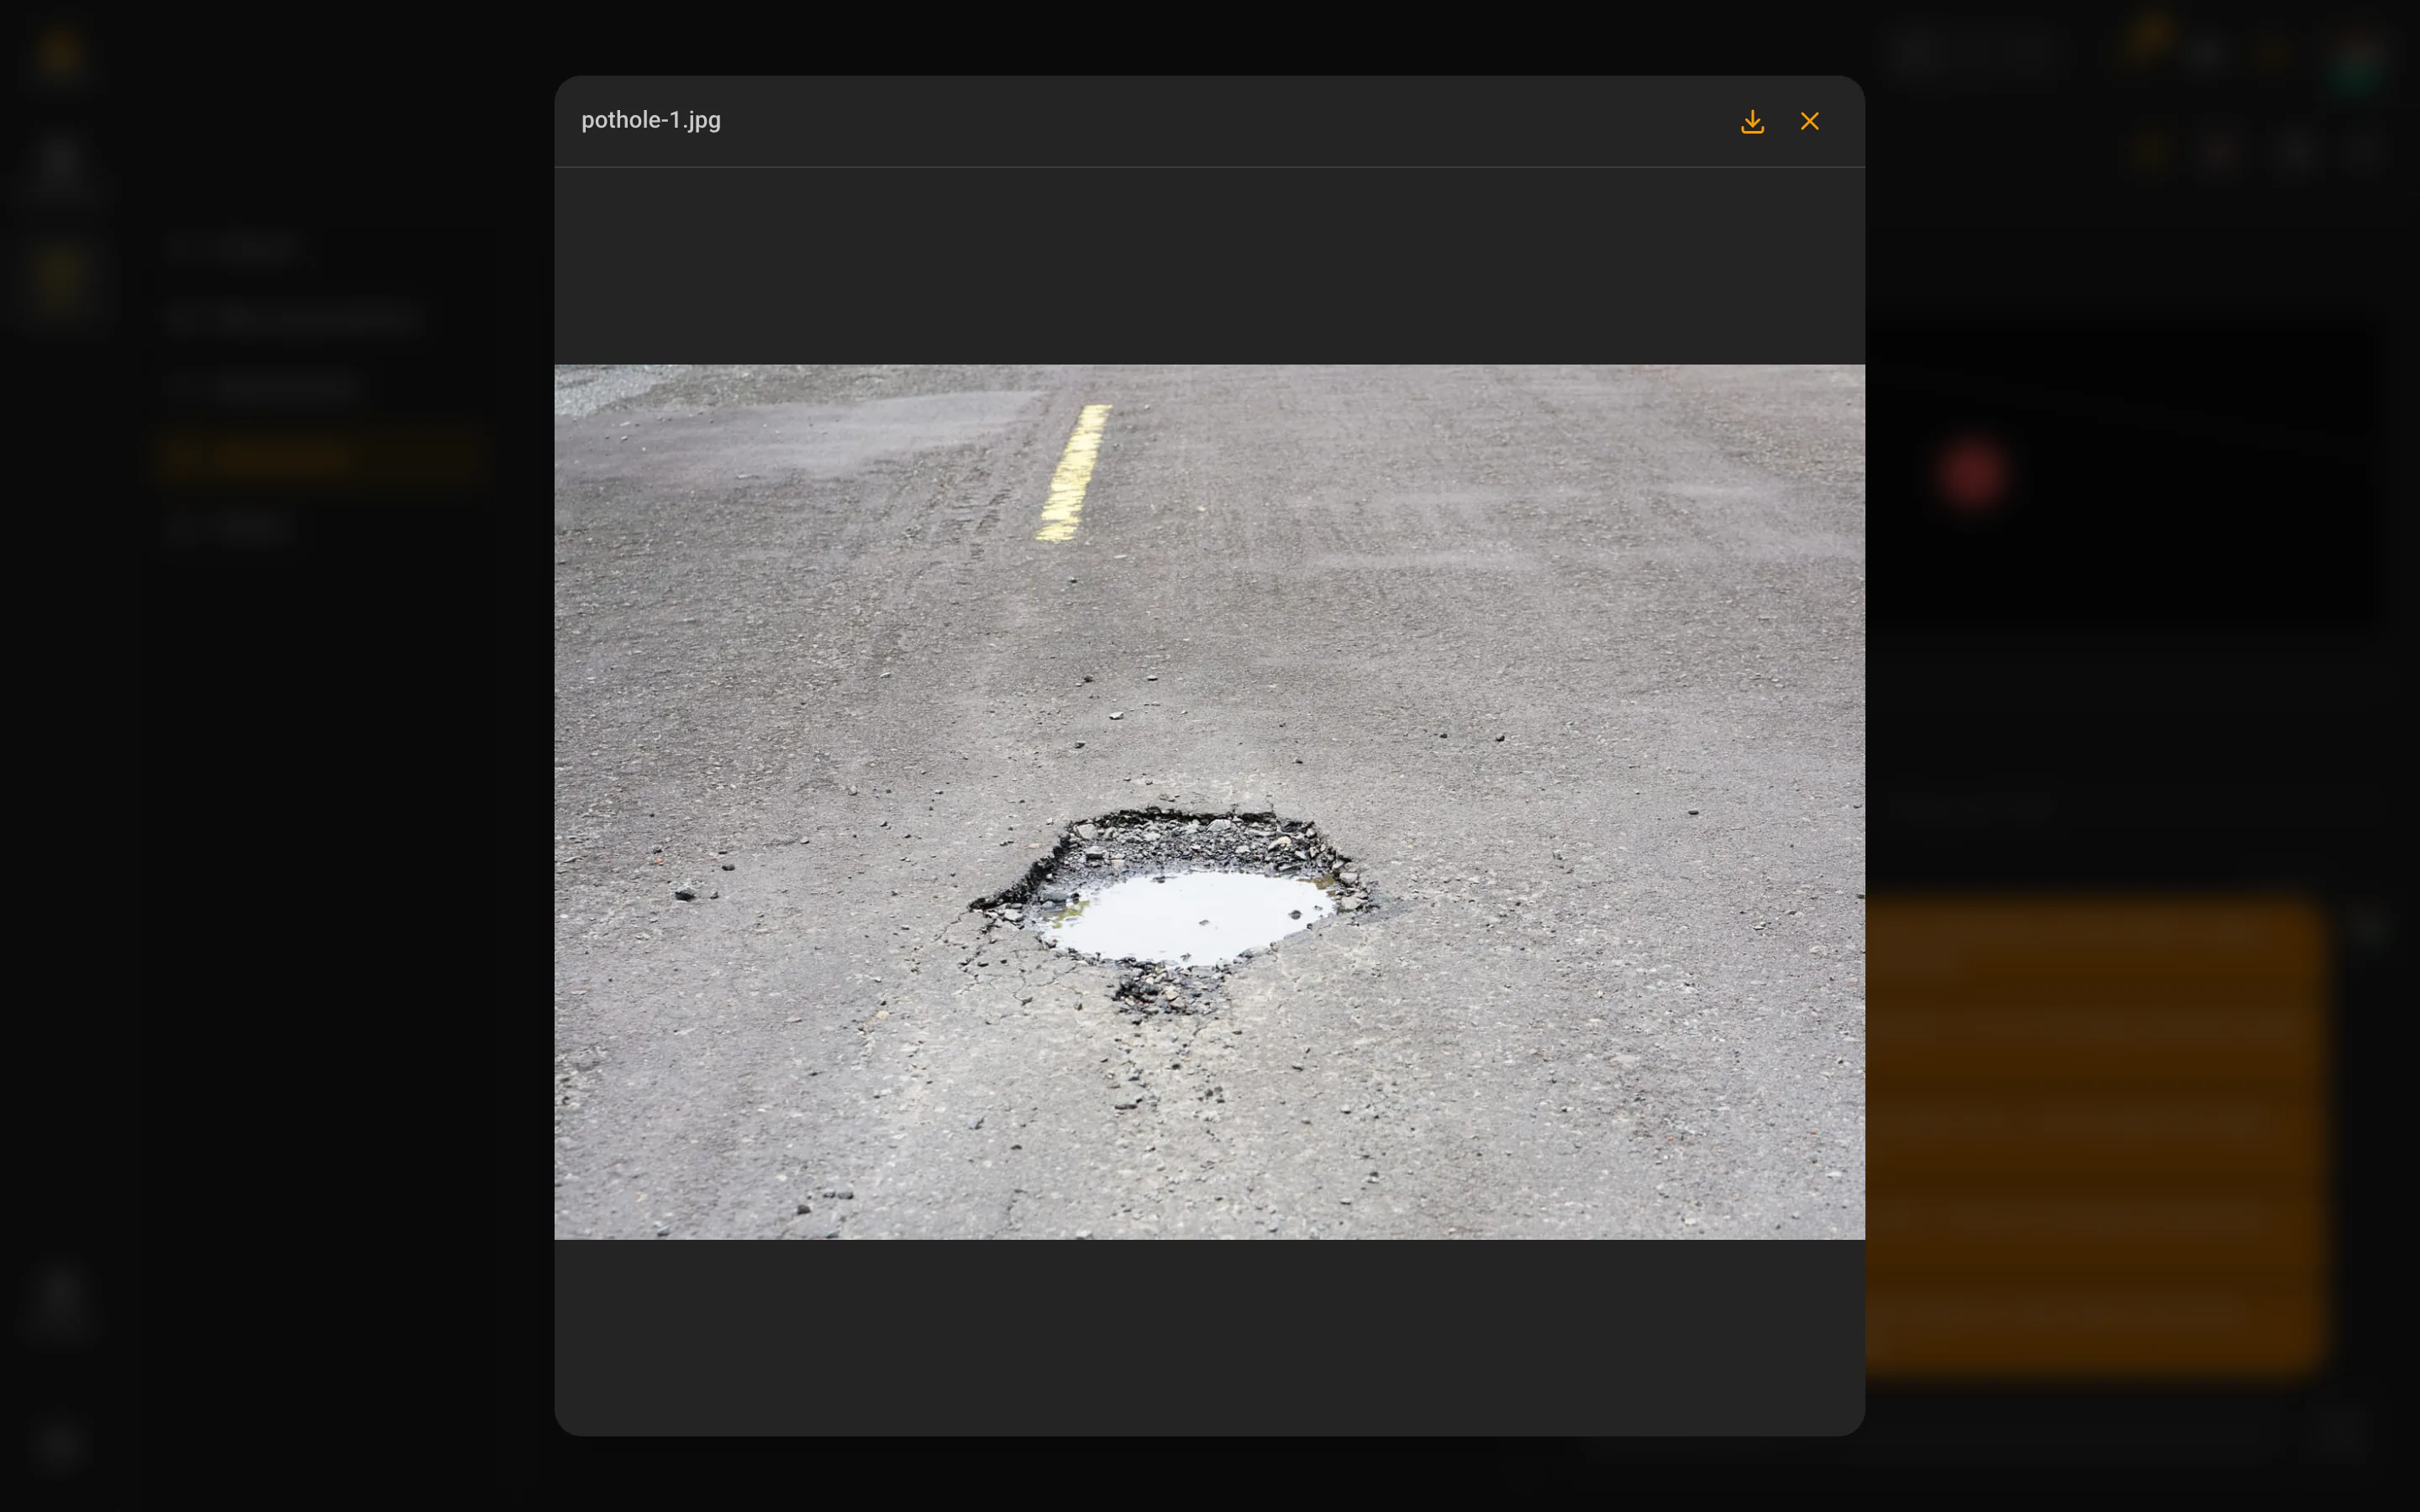
Each point is a structured record, not just a dot. It carries a status, a priority and an assignee, plus a requirements checklist — the control points for this piece of work, like “Assess condition”, “Photograph the damage” or “Secure the site.” The checklist makes sure nothing is forgotten and shows progress at a glance. And every change is stamped into a full history: who created the record, who added the photo, who changed the status — a ready-made audit trail.
Step 3 — It’s the team’s map, so the work is shared
Because everyone opens the same workspace map, a point you save in the field is part of the team’s map straight away — there is no export to email and no layer to publish. Open the link and it is there, with its photo, its status and its exact location.
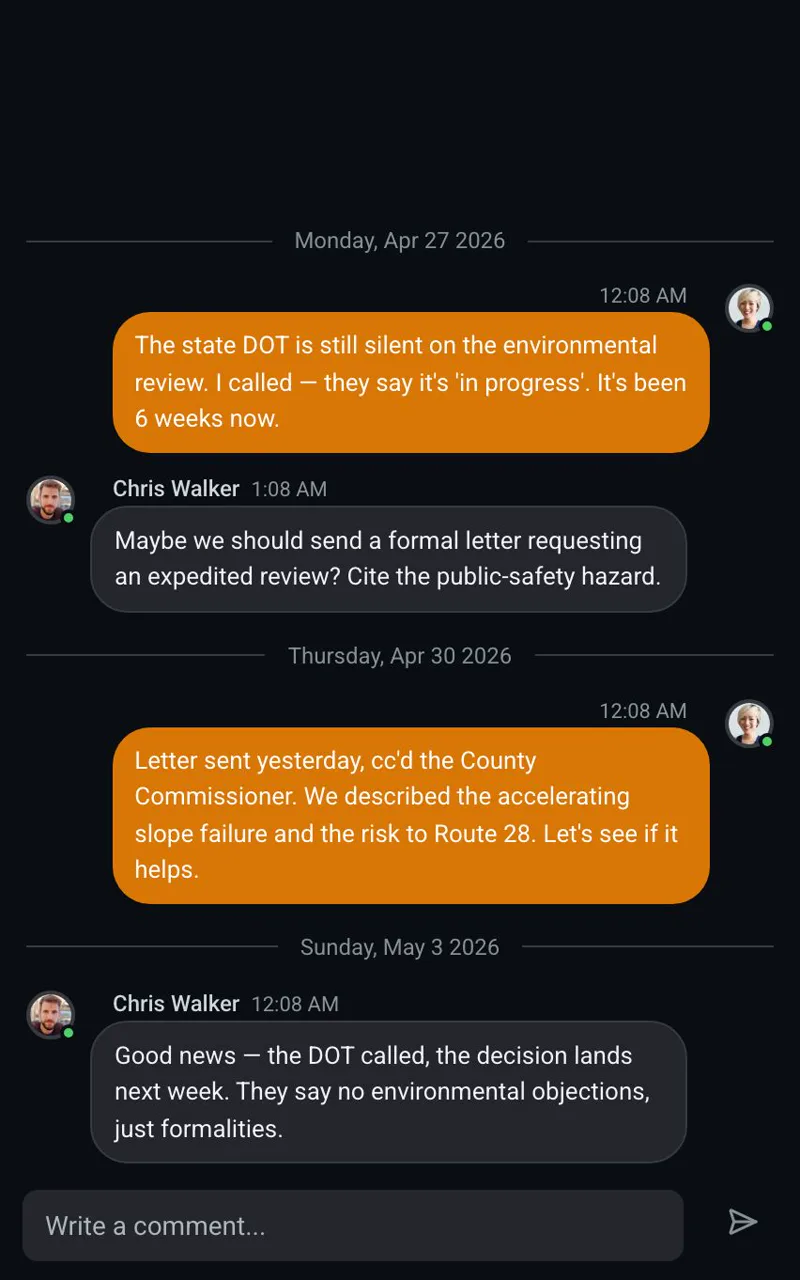
Discussion happens in real time, right on the point. Comments appear the moment a teammate replies — no refresh, no separate email thread — and you can see who is online in the workspace right now. For coordinating an office and a field crew around the same location, that is the difference between a conversation and a data export.
Step 4 — See all your field data three ways
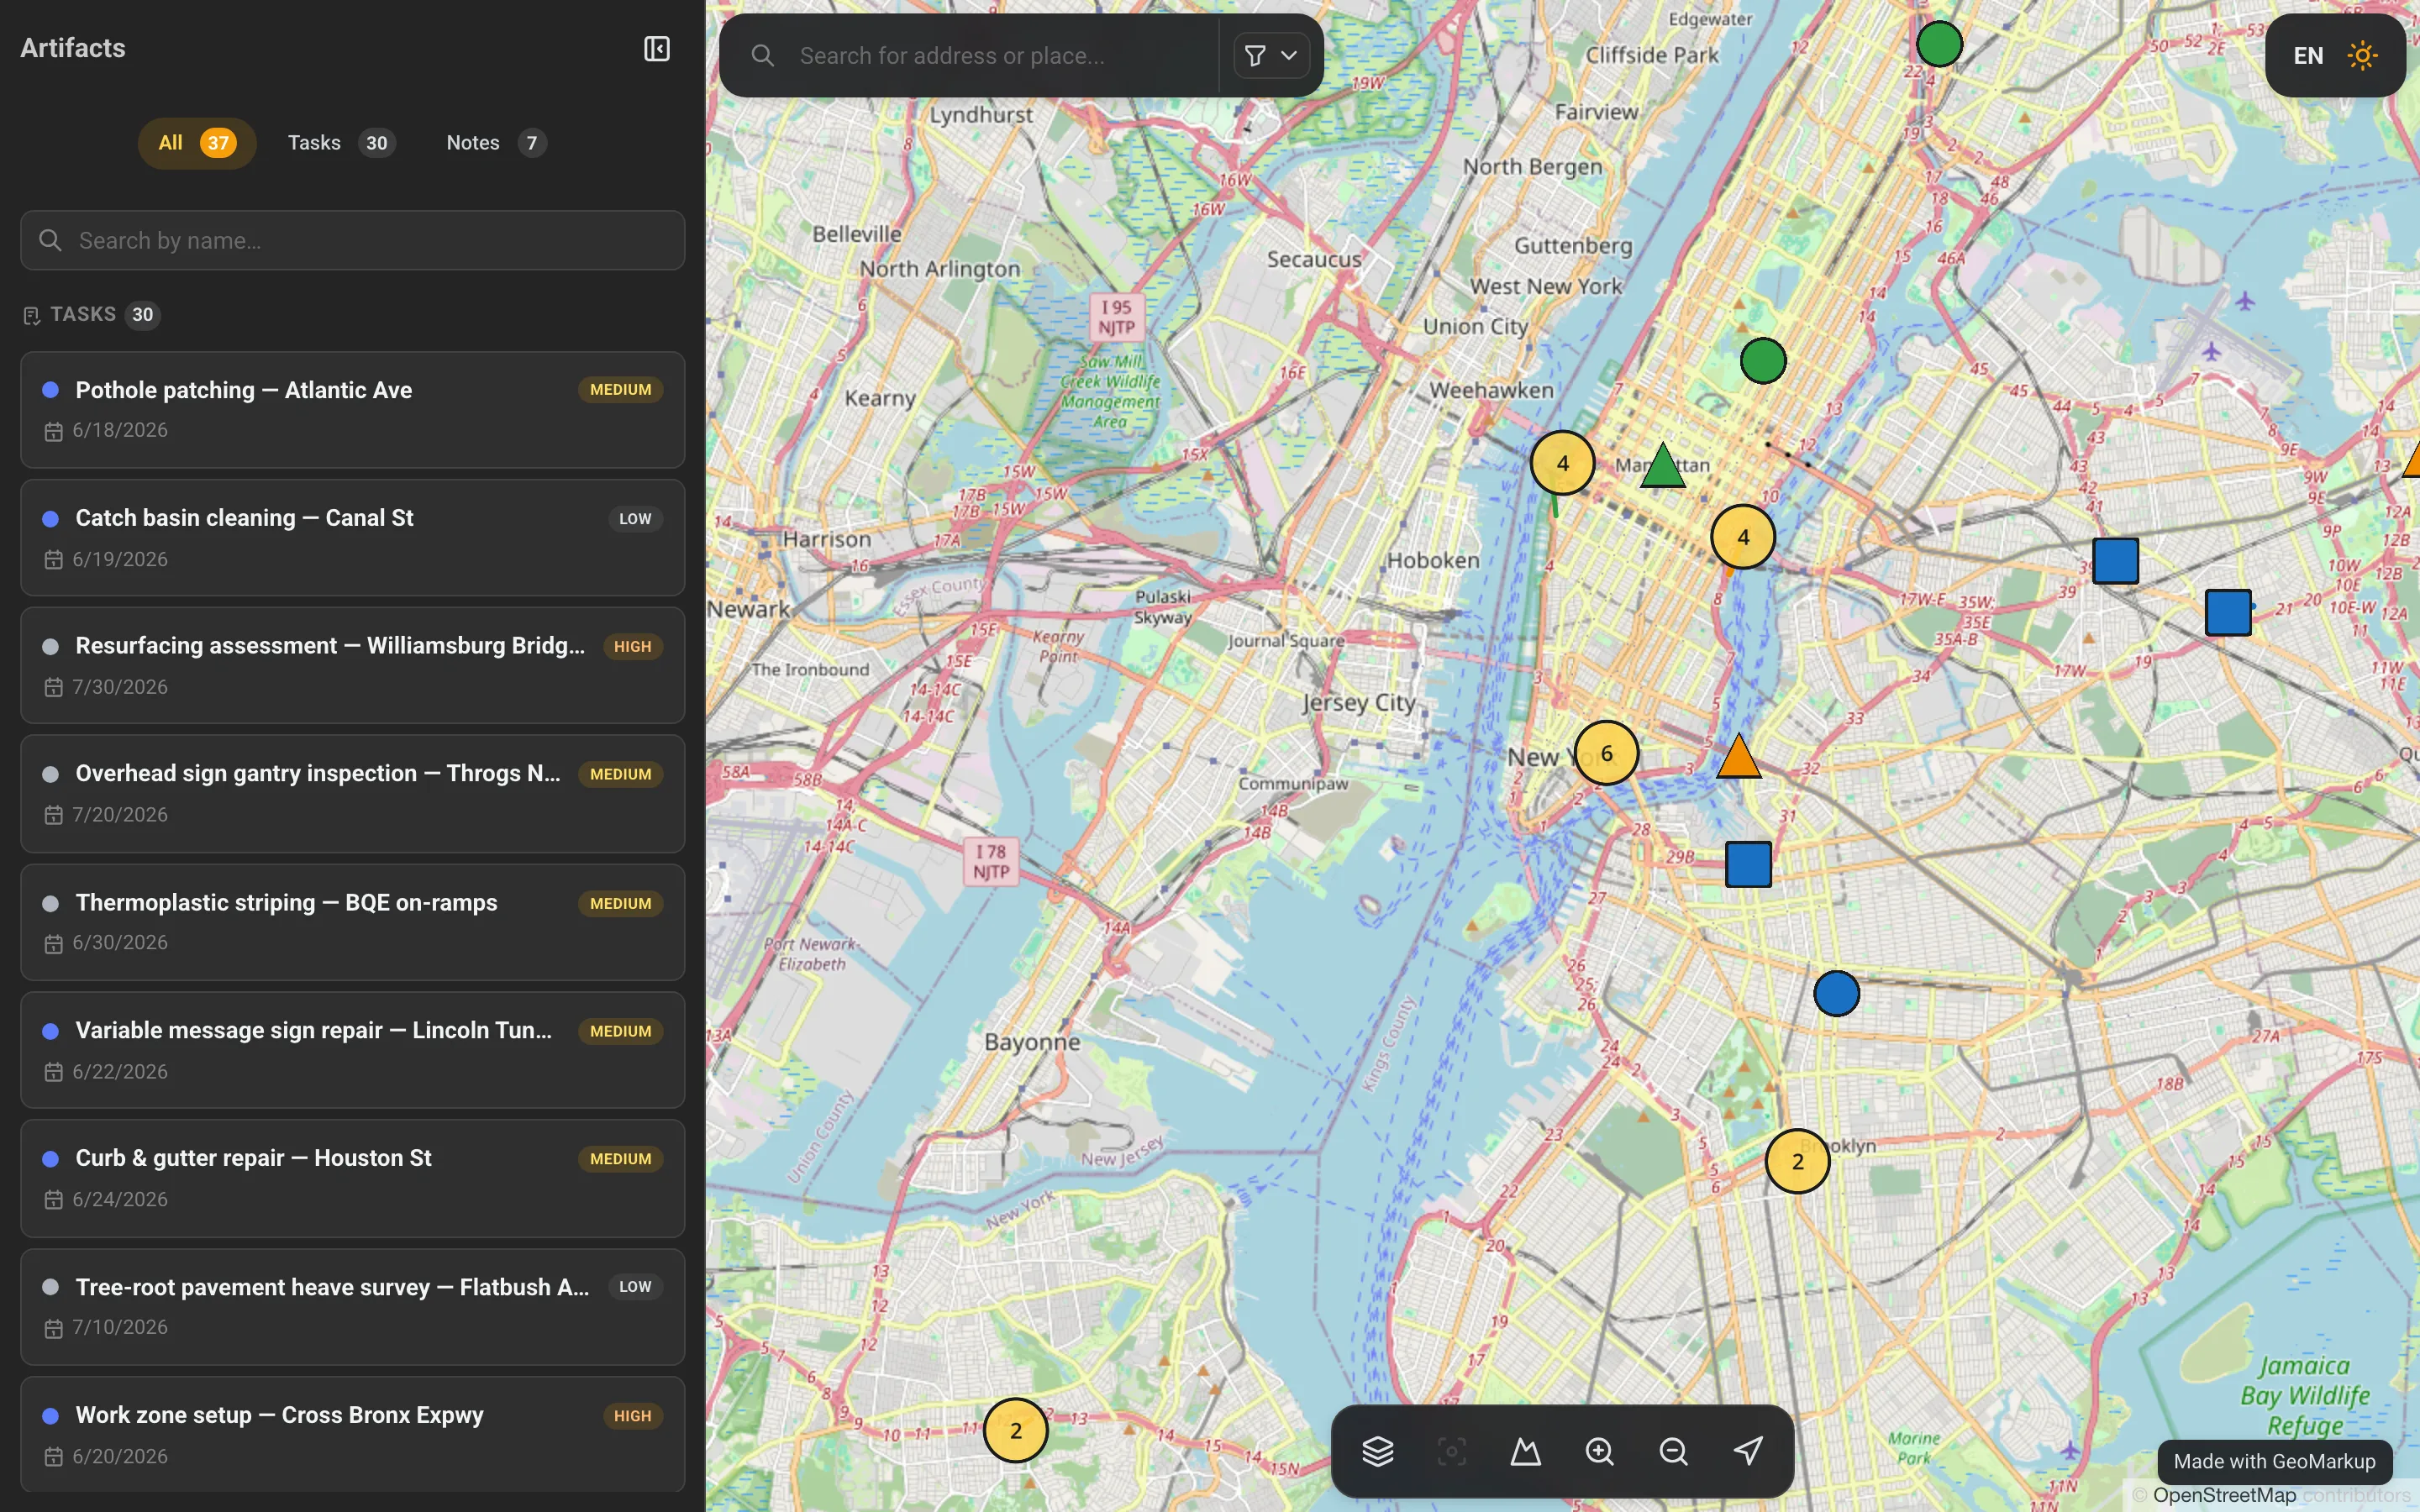
The same field data, organised three ways. Switch between a list, a kanban board and the map without leaving the page. The list is the spreadsheet view — sort and filter by status, priority, location or due date. The kanban groups everything by status, so you drag a card from In progress to Completed as the work moves. The map view shows it all in context.
This is map task management in practice: every piece of field work is a map task pinned to a real place, and you read it as a board, a list or a map depending on the question you are asking.
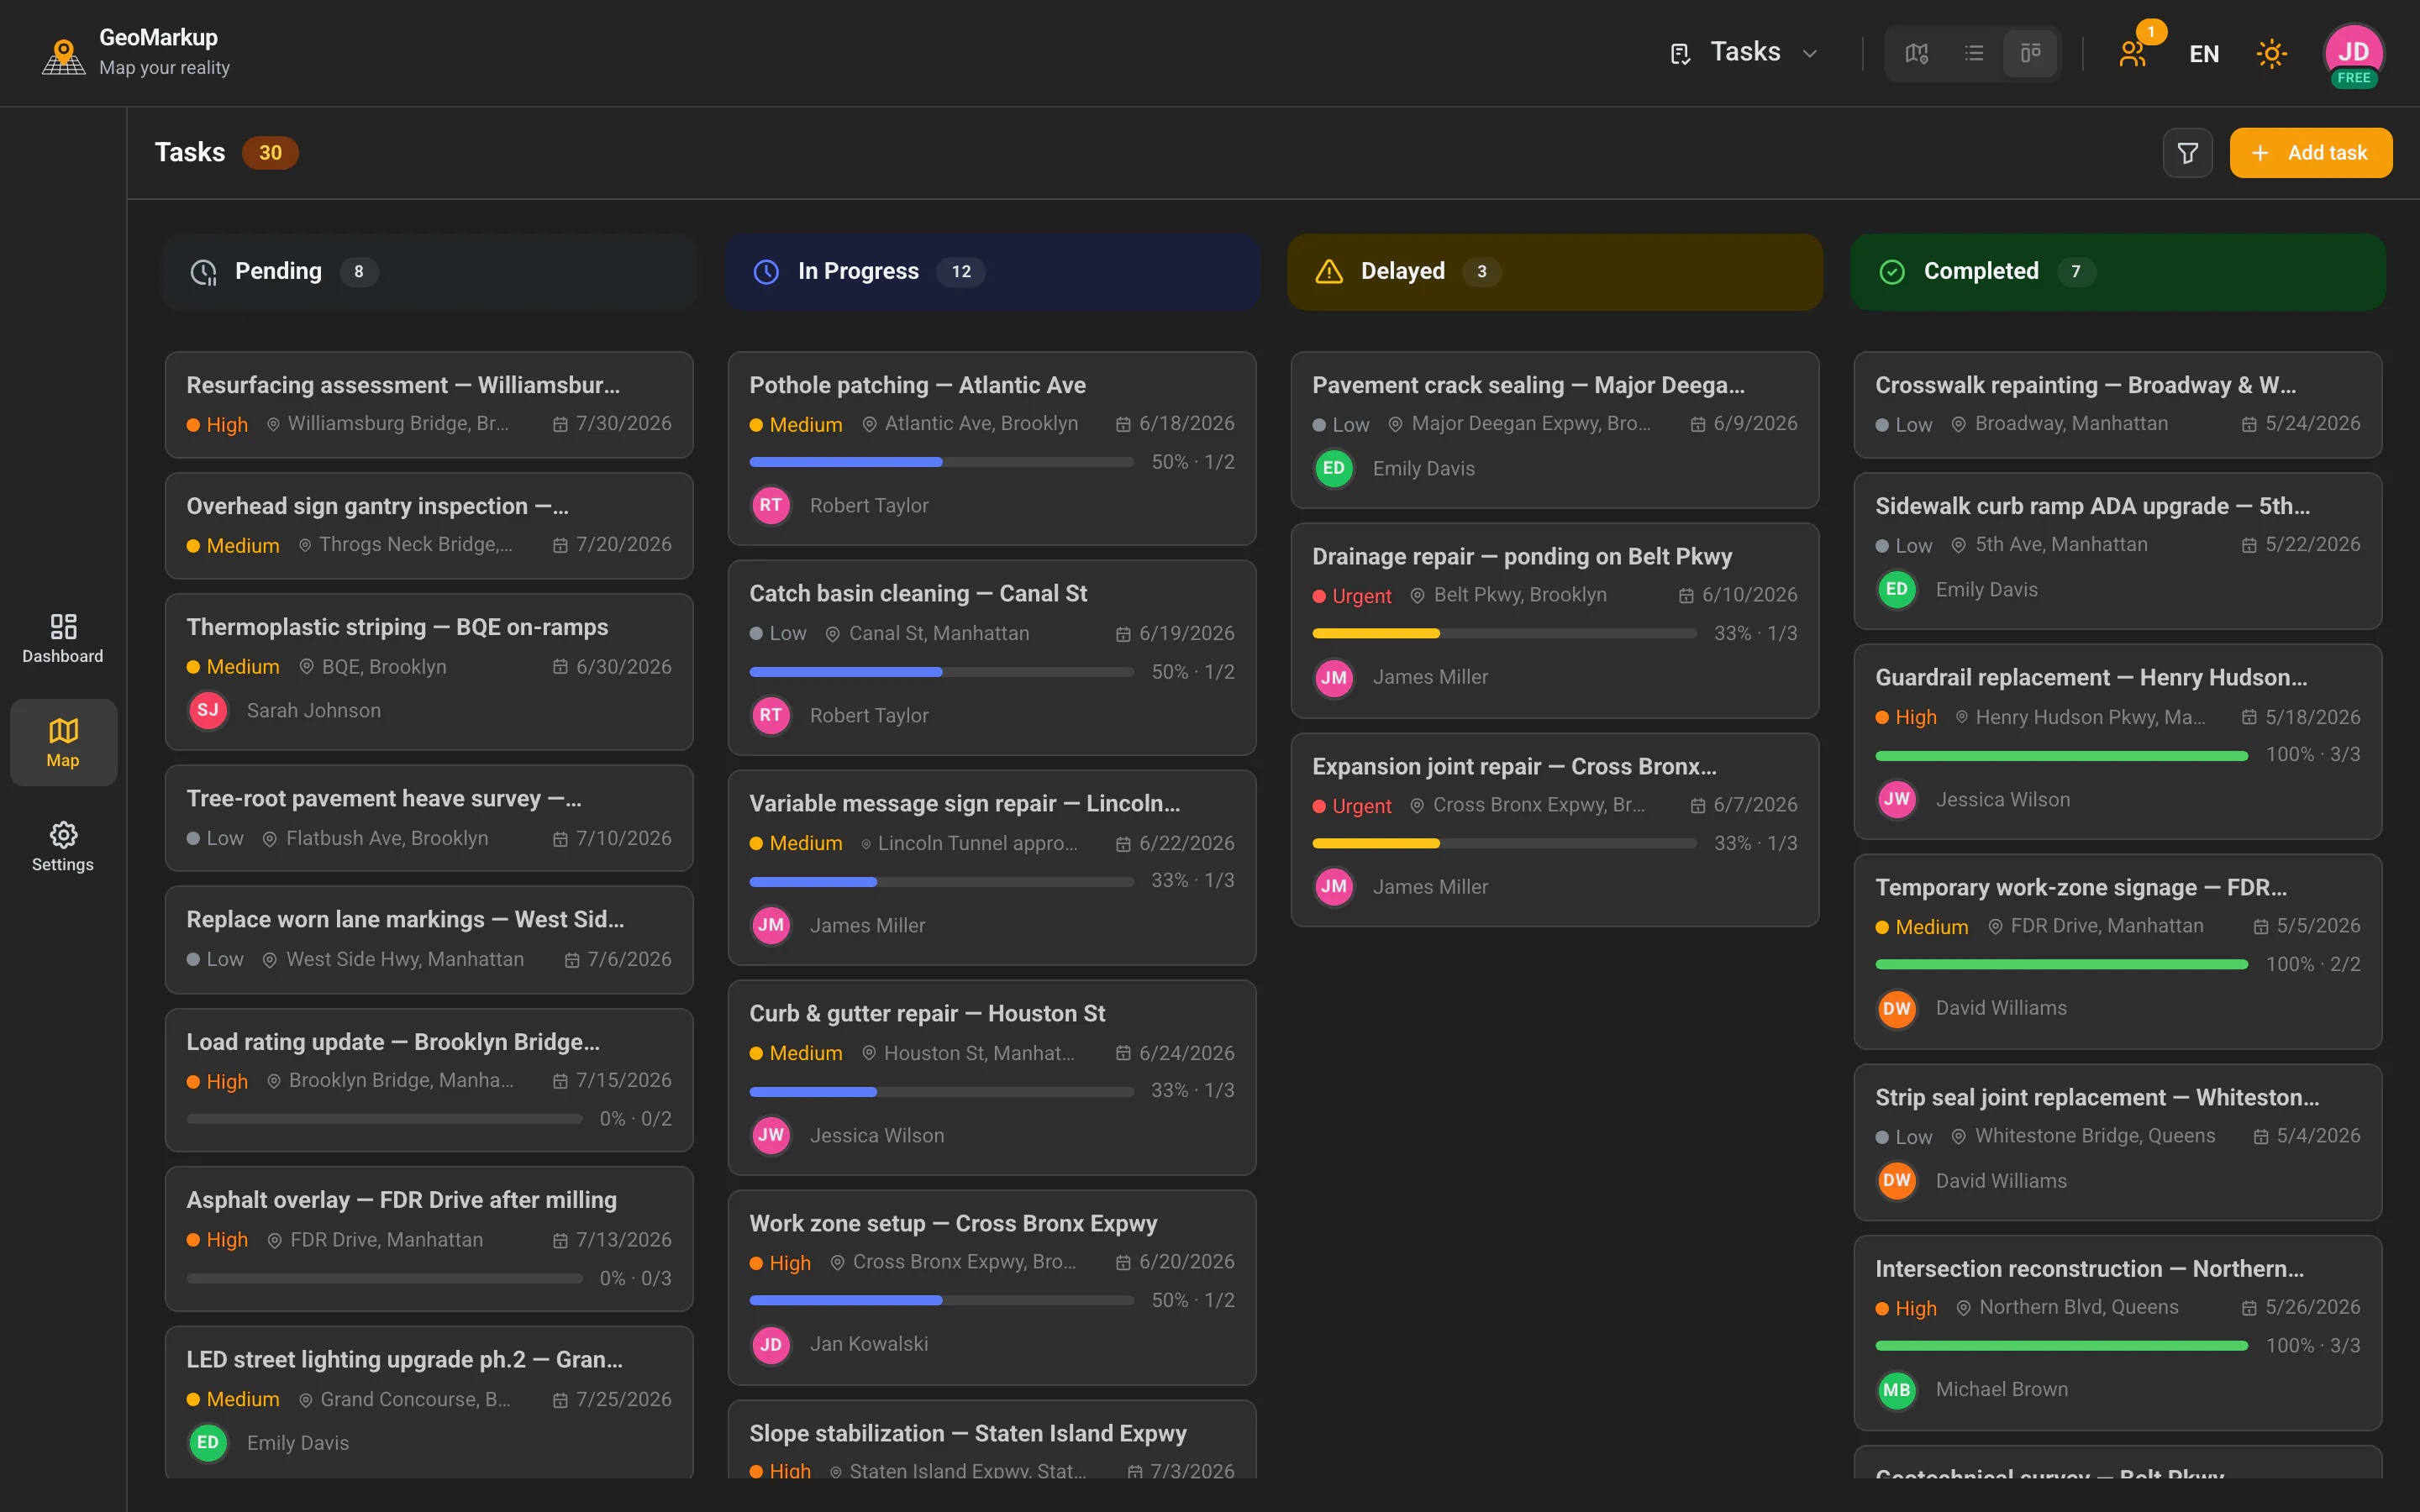
You can filter and search across everything — show only urgent items, only one road, only what is overdue — so a map with hundreds of points stays readable.
Step 5 — Bring your own geodata and basemaps
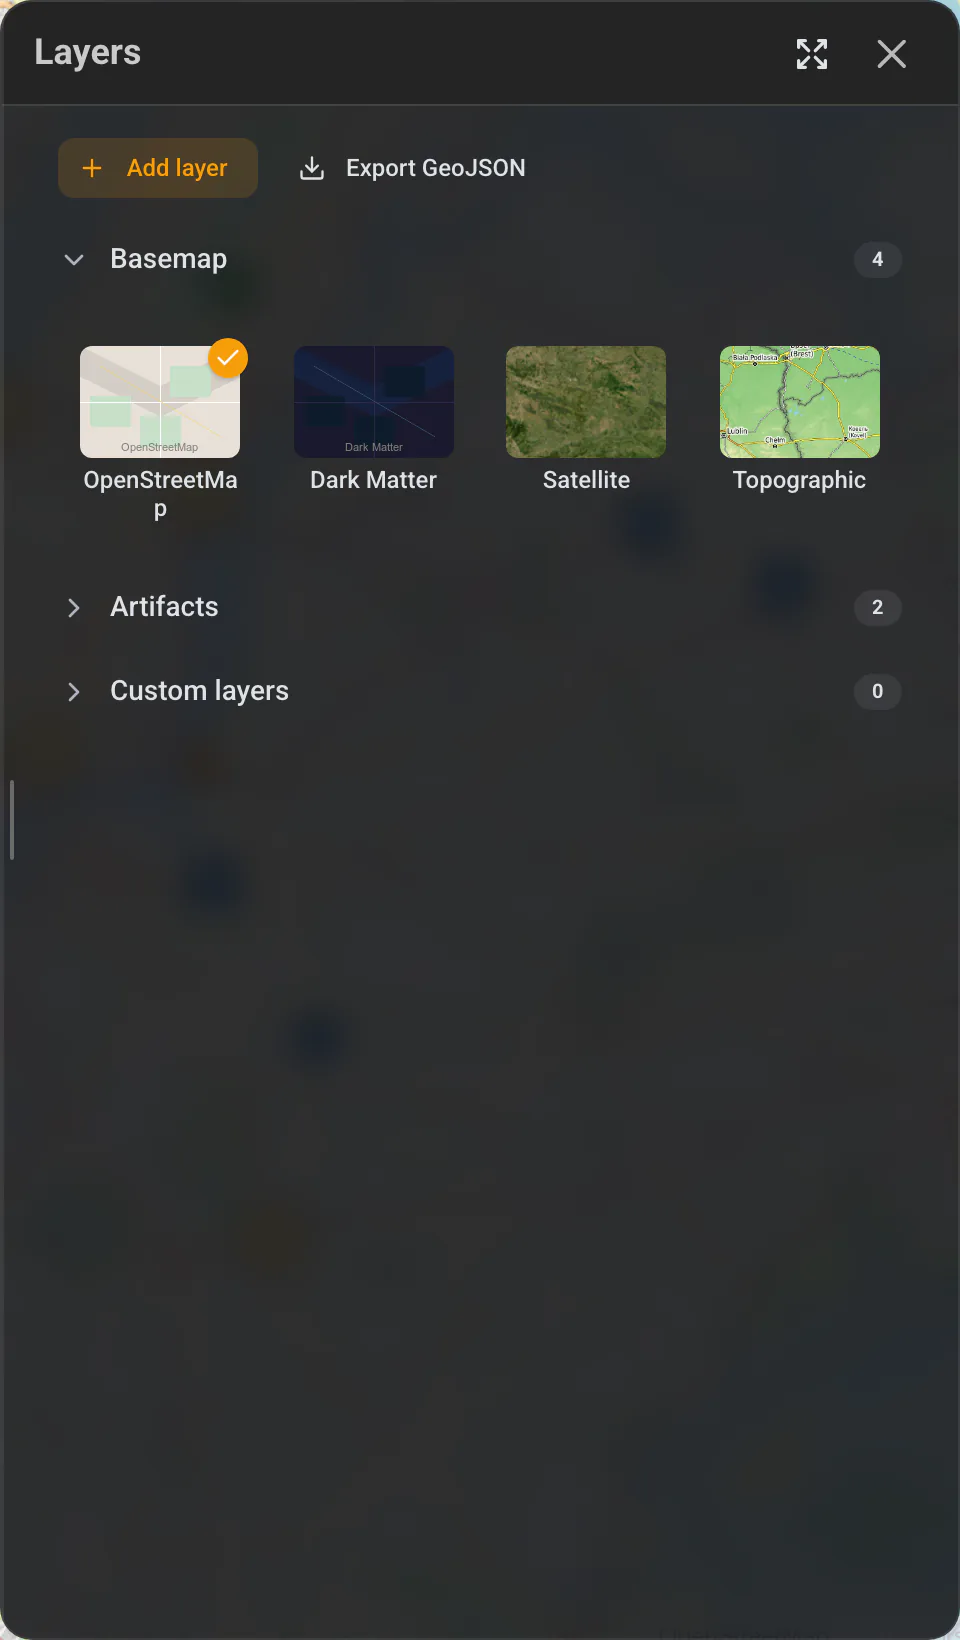
Field data rarely lives alone; it sits on top of the maps and layers you already have. Drag in one of six formats — GeoJSON, KML, KMZ, GPX, GeoPackage or a zipped Shapefile (up to 50 MB) — and it appears as a custom layer, with no publishing pipeline and no server to run. When you need the data back out, export your map to GeoJSON.
You also get seven basemaps out of the box, including orthophoto and satellite imagery, a topographic map and a dark style — so the field crew can work against the aerial view of a site while the office reads the same points on a street map.
Step 6 — Share the live web map with anyone
When the work needs an audience beyond the team — a client, a contractor, the public — you publish a read-only share of the map. A recipient opens an ordinary link in a browser and sees the live map, with no account and nothing to install; you can password-protect it and embed it in another page.
A share is scoped: you choose exactly what it exposes — which layers and basemaps, an initial view, and whether personal data, comments and attachments are shown — so you can share the map of the work without sharing everything behind it.
See the whole picture at a glance
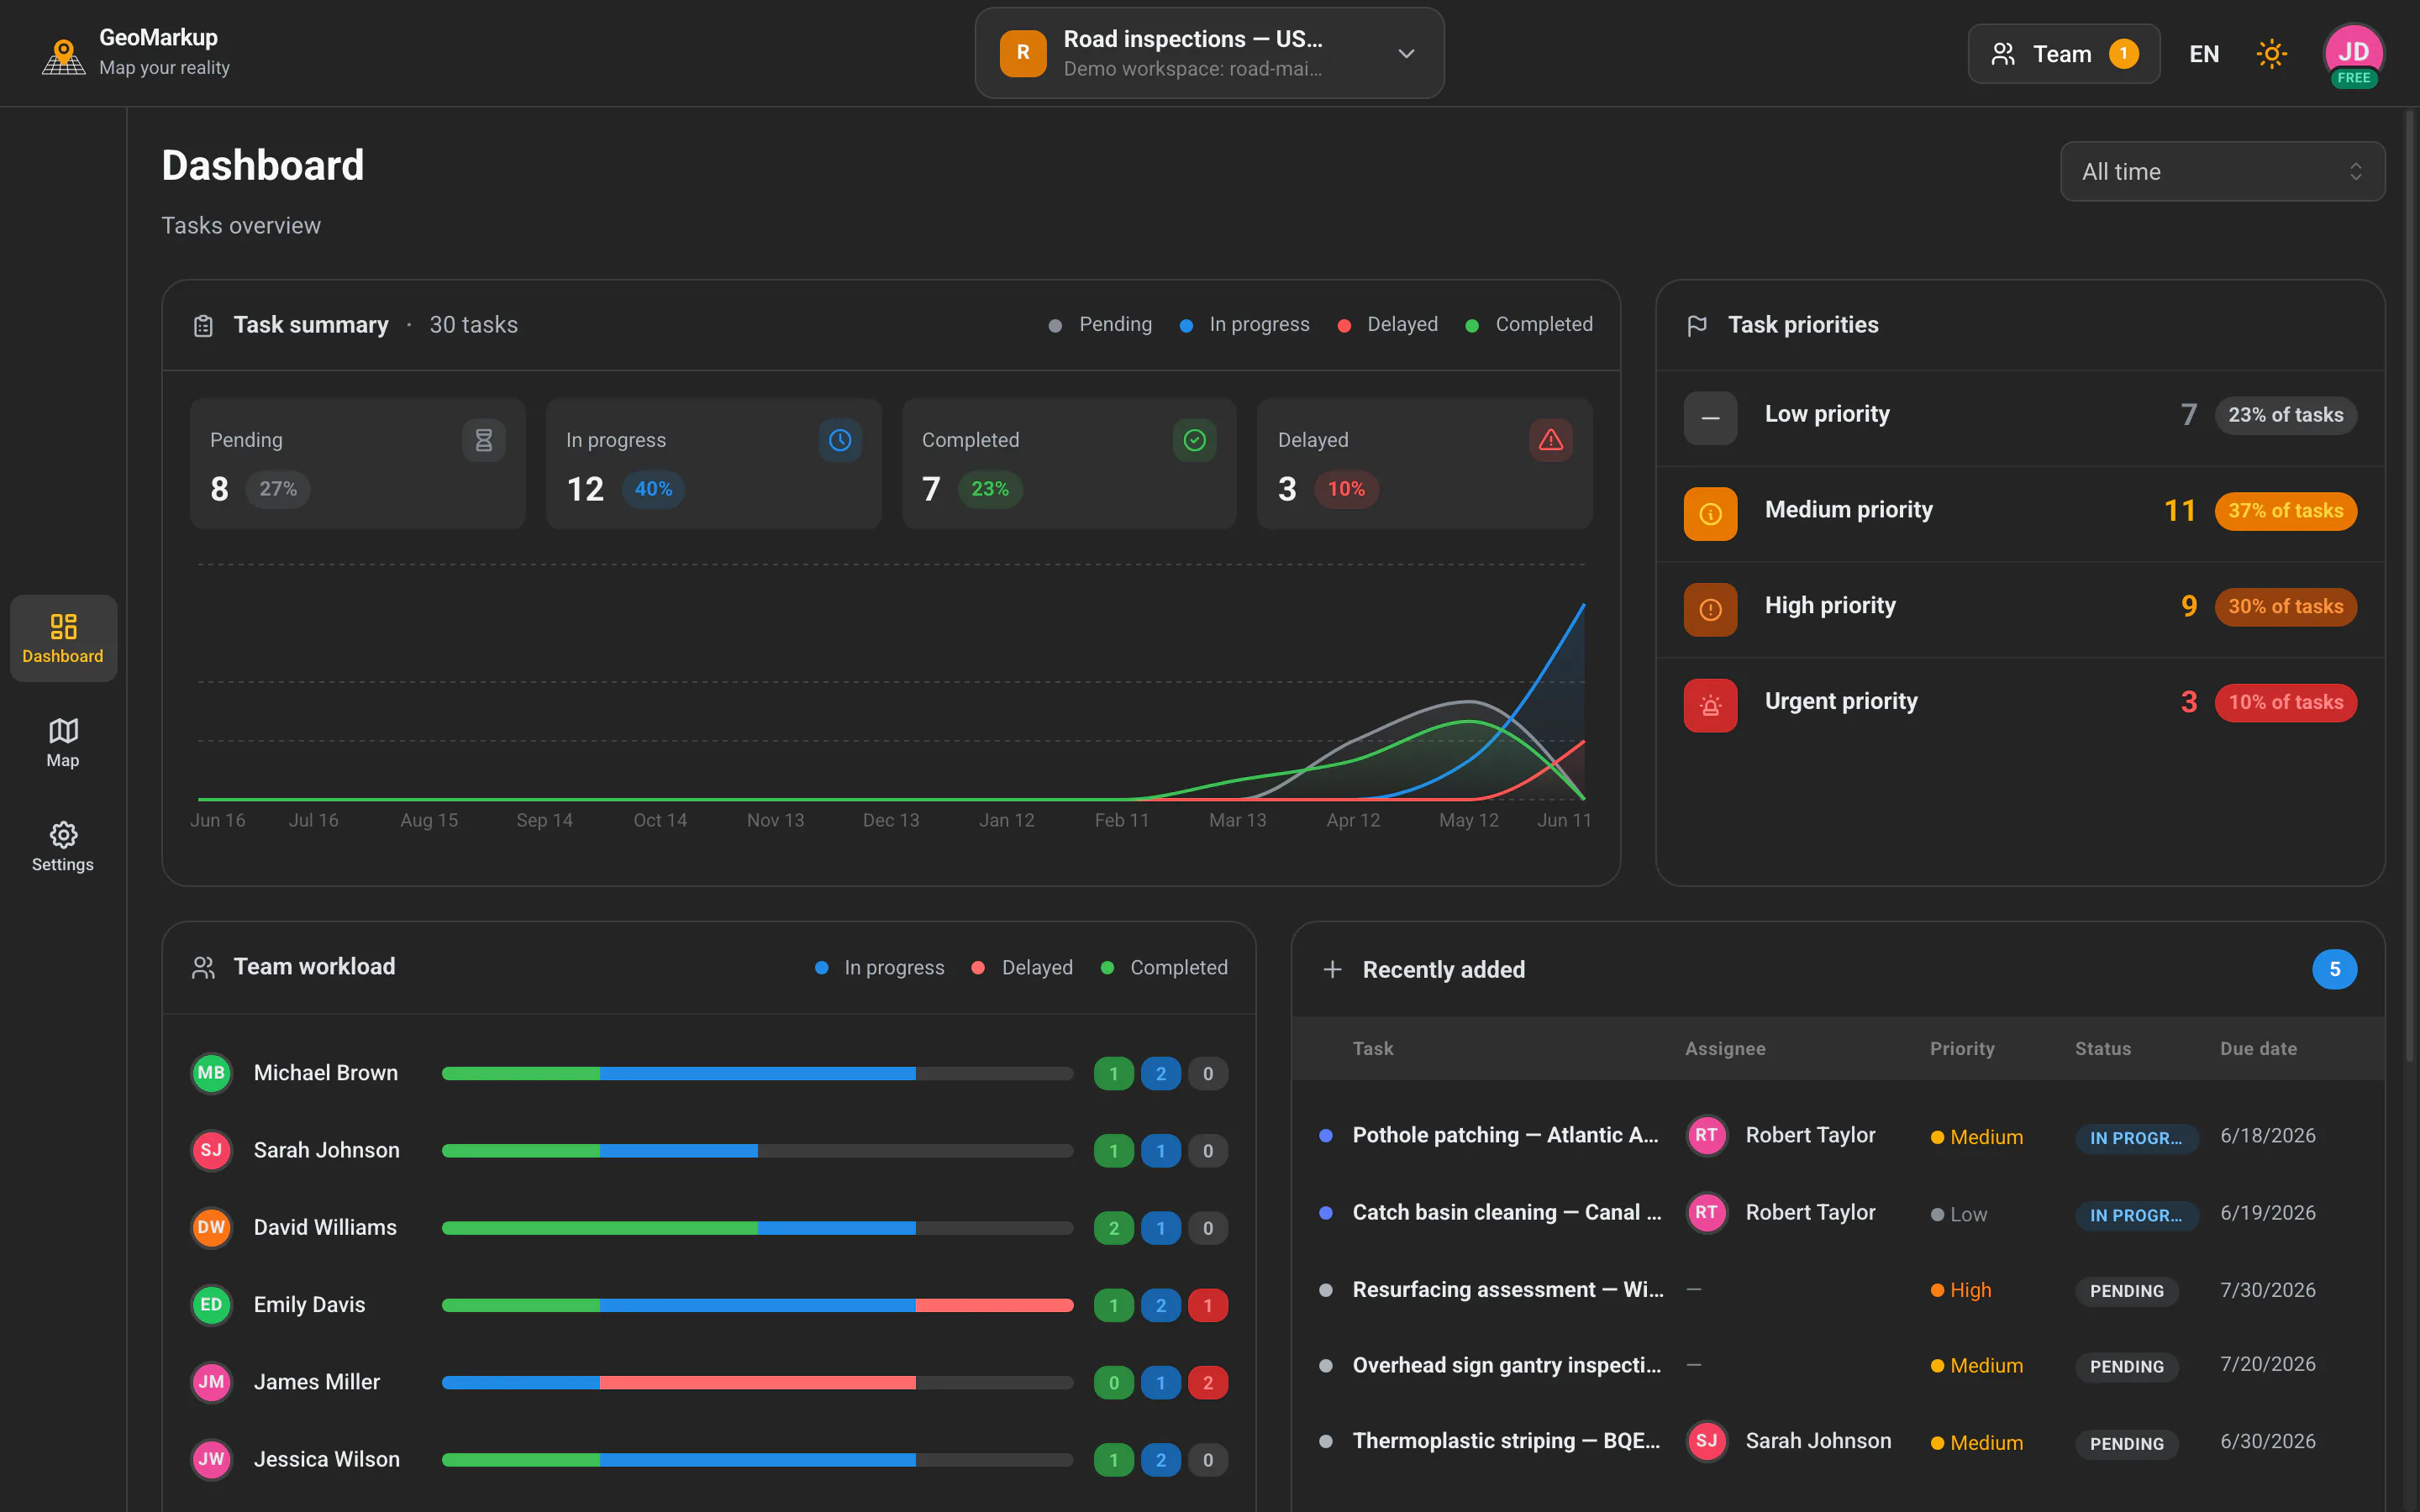
Above the individual points, a dashboard rolls up the field work: how much is open, what is overdue, how it splits by priority and how the load is spread across the team. It turns a map full of points into a status you can read in five seconds.
A concrete example
We built GeoMarkup alongside road-network teams, and this is the workflow we reach for ourselves — so here is how a single piece of field data actually moves.
A field inspector driving the network spots a damaged barrier. Standing at the spot, they open the workspace map on their phone, drop a marker on the exact point (or use GPS), photograph the damage, set the priority to High and assign the work to the maintenance contractor. Back in the office, a coordinator opens the same map from a link — the new point is already there, with its photo and location — drags the card into In progress on the kanban and leaves a question in the comments. The contractor replies in real time, with no email, no export and no sync step. The trip from “spotted in the field” to “assigned and being discussed” took minutes, on one map.
Looking for an ArcGIS Field Maps or Survey123 alternative?
If you arrived here comparing tools, the short version: GeoMarkup is a lighter, free, browser-based way to get field data onto a shared web map and track it as tasks — no Esri org, no per-seat licensing, no install. It is not trying to be a full GIS. For an honest side-by-side, including the cases where ArcGIS Field Maps and Survey123 are still the better choice, read our ArcGIS Field Maps alternative guide.
Where you still need a full GIS or a dedicated offline app
A fair guide names the limits. Choose a dedicated GIS or field app when:
- You need true offline collection. GeoMarkup works online and caches map tiles for a weak connection, but it does not queue edits made with no signal at all. Offline-first capture is on the roadmap, not shipped.
- You need survey-grade accuracy. Points are placed with standard browser geolocation or by clicking the map, not a high-precision external GPS receiver.
- You need advanced spatial analysis or an enterprise geodatabase. Deep GIS analysis and on-premises deployments are firmly Esri’s territory.
If those describe your work, keep your GIS — and use GeoMarkup for the parts that are really about coordinating people around a map.
How to get started
- Create a free workspace — no card required — and set the map to your area.
- Pick a basemap and import your layers — orthophoto, satellite or a standard map, plus your own GeoJSON, KML or Shapefile if you have one.
- Drop your first point in the field — click the spot (or use GPS), attach a photo and set a status.
- Invite your team — they open the same map from a link, comment in real time and track everything from start to done.
The result: field data that lands straight on a live web map instead of getting stuck on a phone or in a sync queue — opened from a link, in the browser, on a phone in the field and a desktop in the office.
Related guides
- Map and tools — drawing, layers, basemaps and geodata import.
- Tasks — how points work as tasks on the map, end to end.
- Map sharing — read-only links, scoping and embedding.
- All guides — more comparisons and how-tos.
Frequently asked questions
How do I sync field data to a web map without ArcGIS or a GIS?
In GeoMarkup there is nothing to sync. You collect data — a point, a photo, a line or a shape — directly on the shared web map in your browser. There is no separate field app to sync from and no web map to publish to: the field and the office work on the same live map, so what you save is already there.
Is there a free tool to put field data on a web map?
Yes. GeoMarkup is completely free right now, with no card and no usage limits. You open it in any browser on a phone, tablet or desktop, drop your field data on the map and share it with your team — no install and no GIS administration.
Does field data appear for the whole team in real time?
Everyone works on the same shared map, so a point saved in the field is part of the team's map immediately — open the link (or reload) and it is there, with its photo, status and exact location. Comments and who-is-online presence update live over a real-time connection, with no refresh.
Can I import my existing GIS data — GeoJSON, KML or Shapefile?
Yes. You can import GeoJSON, KML, KMZ, GPX, GeoPackage and Shapefile (zipped) up to 50 MB as custom layers, and export your map data back to GeoJSON. They appear as map layers with no publishing pipeline and no server to run.
Can GeoMarkup collect field data offline?
Not yet — GeoMarkup works online and caches map tiles so a previously loaded area keeps drawing on a weak connection, but it does not queue edits made with no signal. Offline-first capture is on the roadmap. If collecting data with no connectivity at all is essential today, a dedicated offline app like ArcGIS Field Maps is the better fit.
Is this an ArcGIS Field Maps or Survey123 alternative?
For getting field data onto a shared web map and tracking it as tasks, yes — GeoMarkup is a lighter, free, browser-based option. See our dedicated ArcGIS Field Maps alternative guide for an honest side-by-side, including where Field Maps and Survey123 are still the better choice.
What can the field crew attach to a point — photos?
Yes. You attach photos and files to each point — as many as the case needs, up to 25 MB each. Images open in an in-app preview, so the office and the field crew look at the very same photo without downloading anything first.